
Which Injection Molding Automation System Is Best in 2026?

Which injection molding automation system is best in 2026? The honest answer depends on the parts, process, and people around the machine. A compact robot may suit a stable, high-volume cell. A flexible system with vision inspection and automated changeovers may fit a plant running short batches. There is no universal winner.

Dr. John Beaumont, an injection molding educator and author, has emphasized the importance of understanding the molding process as a whole. A practical paraphrase of that guidance is: automation should support stable molding, not simply move parts faster. That distinction matters. A robot removing a warm part, a conveyor carrying it to inspection, and a camera checking a gate mark all need to work within the real cycle—not just the sales brochure’s ideal one.

Small details matter. This guide compares Cartesian and articulated robots, part handling, in-mold labeling, inspection, and integrated production cells. It also considers setup time, floor space, service access, and how easily operators can recover from a fault. A fast cell can still disappoint if a gripper change takes half a shift. And one practical question is easy to overlook: who will maintain it on the night shift?

The best Injection Molding Automation system is the one that fits your production mix and delivers dependable results. We’ll look at what to measure, what to ask suppliers, and where automation may add complexity instead of value. Not every process needs a fully connected cell. Sometimes a simpler solution is the wiser choice.
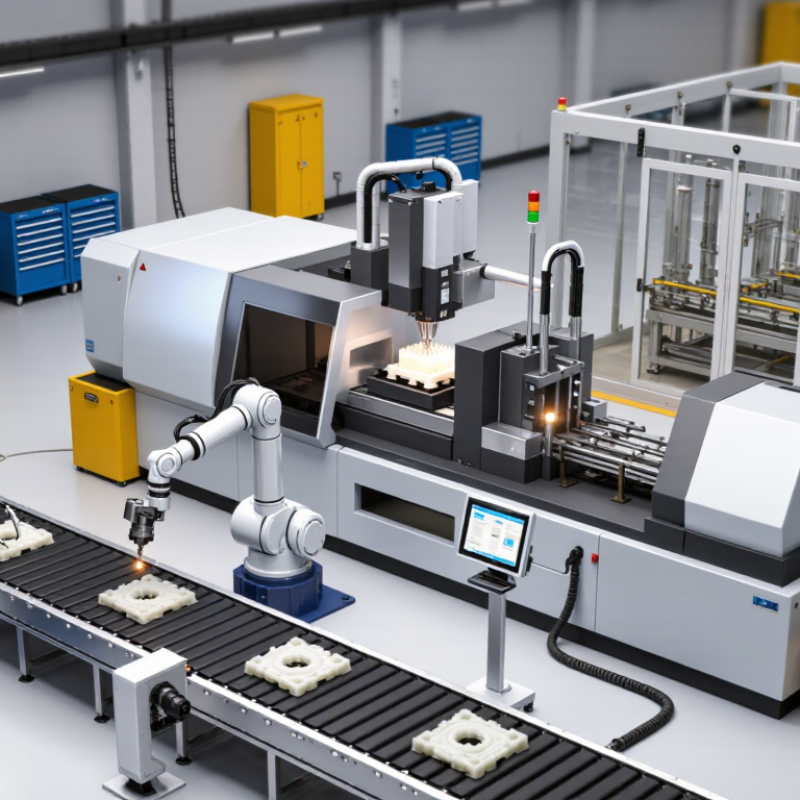
Which Injection Molding Automation System Is Best in 2026?

Define the Cell: Press, Robot, End-of-Arm Tooling, and Peripherals

Which Injection Molding Automation System Is Best in 2026?

Define the Cell: Press, Robot, End-of-Arm Tooling, and Peripherals

The best injection-molding cell is designed as one coordinated system, not a press with a robot added later. Start with the press: confirm clamp capacity, opening stroke, cycle time, and available space for mounting. Then size the robot for reach, payload, and safe access to the mold. IFR’s World Robotics 2024 report recorded 541,302 industrial robot installations worldwide in 2023, across industries—not injection molding alone. That broader growth makes integration skills valuable, but it does not identify the right cell for every part.

End-of-arm tooling should grip the part securely without marking visible surfaces or slowing release. A cup-and-finger arrangement may suit a rigid housing; thin, flexible parts often need gentler support. Include conveyors, part-present sensors, temperature control, and reject handling in the layout. These peripherals affect cycle time and uptime.

A cell can look perfect in a simulation and still struggle with a sticky part or crowded operator access. That deserves a real trial.

Compare Cartesian, 6-Axis, and Collaborative Robots by Reach and Payload

Choosing an injection molding automation system in 2026 starts with the part, machine layout, and required handoff—not robot type alone. A Cartesian robot moves along straight axes above the press, making its reach easy to map and its payload suitable for many grippers and molded parts. It fits repeatable takeout paths but needs overhead clearance. Measure twice.

A six-axis robot can approach a mold from varied angles and serve nearby machines, trimming, or inspection stations. Its reach spans a curved working envelope, so a nominal reach figure does not guarantee access behind guards or around a hot mold. Payload calculations should include the end-of-arm tooling, cables, and part. This is often overlooked.

Collaborative robots can suit lower-payload tending, packaging, or inspection where people share floor space, but collaboration does not automatically make every task safe. Check cycle time, reach at the required pose, and stopping behavior with the actual tool. A compact cell may outperform a longer arm. Sometimes it won’t. Compare usable reach and total load under real conditions; catalogs simplify things, and early layout assumptions can be wrong.

Which Injection Molding Automation System Is Best in 2026?

Typical reach ranges and payload capacities for Cartesian, 6-axis, and collaborative robots

Typical reach range Payload ranges: Cartesian 1–20 kg · 6-axis 3–30 kg · Collaborative 3–20 kg

Cartesian systems suit repeatable, linear pick-and-place and can be configured for larger loads or strokes. Six-axis robots offer flexible access around the molding machine and generally the broadest reach. Collaborative robots can be easier to deploy near people, but actual safe operation depends on a risk assessment and the complete application. Ranges are indicative examples, not category limits; check the specific robot, end-of-arm tooling, and machine layout.

Use IFR’s 162 Robots per 10,000 Manufacturing Employees as a Benchmark

The International Federation of Robotics (IFR) benchmark of 162 robots per 10,000 manufacturing employees offers a useful reference for evaluating injection molding automation in 2026. It is a comparison point, not a quota for every plant. Robot density describes adoption across manufacturing; it does not show whether a molding cell is productive, flexible, or easy to maintain. That distinction matters.

For an injection molder, the better question is what work the system reliably removes from the cycle. A take-out robot may place hot parts on a cooling conveyor, while an end-of-arm tool separates runners and positions components for inspection. Track cycle-time variation, unplanned stops, changeover minutes, rejected parts, and operator walking distance. Compare results across the same shift and product mix. Small details count.

A plant below 162 robots per 10,000 employees may still be well automated if its product mix is varied or volumes are low. A plant above it may have robots that sit idle between jobs. The benchmark cannot tell you whether grippers suit the part, guarding fits the layout, or maintenance staff can recover a fault quickly. Record baseline performance before investing, then test a representative mold and a real changeover. Some estimates will be wrong; revise them with production data.

Consider IFR’s 541,302 Industrial Robots Installed Worldwide in 2023

The International Federation of Robotics reported 541,302 industrial robot installations worldwide in 2023. That is substantial. But the figure covers many industries, not injection molding alone, and it does not reveal which automation system performs best in 2026. It is a useful signal of broad adoption, not a machine-selection shortcut.

For a molding cell, start with the actual task: removing hot parts, placing inserts, trimming runners, or stacking components. Check the robot’s reach and payload against the mold layout, then compare its cycle time with the press. A take-out robot may suit a simple, repeatable part; a more complex cell may need coordinated handling, inspection, and conveyor placement. Ask suppliers to demonstrate the full cycle using representative parts, not an idealized animation. A few seconds saved can matter, but so can safe access for mold changes and easy recovery after a jam.

The global installation count shows automation is established, yet it says little about local fit. A tidy spreadsheet can miss awkward part orientation or a cramped service aisle. That matters. Revisit those assumptions before choosing a system.

Select a 2026 System by Part Mix, Cycle Time, Safety, Uptime, and ROI

The best injection molding automation system in 2026 depends on what your press actually makes. A line handling one stable part may need only a take-out robot and a simple conveyor. Mixed production calls for faster changeovers, adaptable grippers, and recipes operators can verify without hunting through menus. Measure the variation. Part weight, insert position, and packaging requirements can change the handling plan.

Cycle time matters, but the robot’s speed is only part of the calculation. Compare the full sequence: mold opening, part removal, trimming, inspection, and transfer. A fast robot can still wait on a slow downstream station. Check reach, payload, and access around the mold, then test the proposed layout with real parts. Small details count, like whether a gripper clears a hot runner or leaves room for maintenance.

Safety and uptime need equal attention. Review guarding, interlocks, and safe access during routine clearing and tool changes. Ask how faults are diagnosed and how quickly common components can be replaced. Track unplanned stops, scrap, labor hours, and changeover time against the purchase and integration cost. ROI estimates are useful, but they often look too neat; include training, spare parts, and production disruption. The right system should fit the shop’s actual staffing and maintenance skills, not just its ideal cycle-time target.

Which Injection Molding Automation System Is Best in 2026?

Compare system types by part mix, cycle time, safety, uptime, and indicative return on investment.
Automation System Best Fit by Part Mix Typical Cycle-Time Planning Range Changeover and Flexibility Safety and Integration Priorities Uptime Planning Target Illustrative Payback Range
Sprue Picker Simple, repeatable parts with limited downstream handling; low-to-medium production volumes. About 15–45 seconds per molding cycle; suitability depends on part release and picker motion. Low setup complexity for a stable part family; less suitable for varied orientation or secondary operations. Assess guarding, mold-area access, safe maintenance access, and coordination with the molding machine. Plan around 85–92% cell availability after commissioning, subject to maintenance and process stability. About 6–18 months when it reliably reduces manual handling or prevents a production bottleneck.
Cartesian Take-Out Robot with Conveyor Consistent, medium-to-high-volume parts requiring repeatable removal and basic part transfer. About 10–60 seconds per molding cycle; robot motion should fit within the available mold-open window. Good for repeat production; end-of-arm tooling and robot programs may need adjustment for new parts. Verify interlocks, guarded access, robot stopping behavior, and safe recovery procedures. Plan around 88–95% cell availability once the process and changeover method are established. About 9–24 months if labor can be reassigned and the cell runs consistently across shifts.
Robot Cell with Secondary Operations Parts requiring trimming, inspection, insert handling, assembly, or organized packaging after molding. About 20–90 seconds per part-handling sequence; parallel operations can help preserve molding throughput. Moderate flexibility; fixtures, tooling, and operation recipes must be controlled for each part family. Include risk assessment for the complete cell, including tooling, conveyors, fixtures, and operator access. Plan around 85–93%; integrated equipment can create additional sources of downtime. About 12–30 months, depending on labor reduction, scrap avoidance, and how fully the cell is utilized.
Vision-Guided Flexible Robot Cell High-mix production, variable part presentation, or applications needing automated inspection and sorting. About 20–90 seconds per cycle, depending on image acquisition, decision time, robot travel, and handling steps. High flexibility when recipes and validation are well managed; new parts still require setup and verification. Validate vision limits, reject handling, guarded robot motion, and safe access for setup and troubleshooting. Plan around 85–93%; image quality, lighting, and part variation can affect availability. About 18–36 months or longer; strongest when inspection or sorting also reduces measurable quality costs.
Integrated Multi-Machine or Lights-Out Cell Stable, high-volume parts with predictable demand, reliable processes, and limited product variation. About 15–60 seconds per machine cycle; shared robots and material flow must avoid machine starvation or blocking. Lower flexibility than a single-machine cell; product changes may require coordinated tooling, programs, and schedules. Design for monitored access, safe fault recovery, material replenishment, and emergency response without routine entry. Plan around 85–95% across the cell after ramp-up; one bottleneck can limit the whole system. About 24–48 months or longer; depends heavily on sustained demand, utilization, and avoided labor or downtime.

How to use these figures: Cycle-time and availability values are planning ranges, not guarantees. Payback ranges are illustrative and can vary substantially with local labor costs, shifts, utilization, integration scope, maintenance, scrap reduction, and whether labor is actually reduced or reassigned. Confirm the application with a process study, a whole-cell safety risk assessment, and supplier quotations before selecting a system.